Extending Wazuh detection capabilities with clickdetect, Opensearch PPL and Sigma Rules
Hey, souzo here. If you've ever wanted alerting rules that actually work in Wazuh without fighting OpenSearch's detection engine, this post is for you.
Repository: https://github.com/clicksiem/clickdetect
In this blog post I will guide you to: - Install and configure Opensearch PPL in an existing Wazuh environment - Install and configure clickdetect - Write Opensearch PPL - Write Sigma rules with Opensearch PPL - Detect threats with your Wazuh data extending wazuh detetion capabilities
Introduction
After working many years with wazuh and opensearch, I wanted some features that currently not exists or are so broken to work with.
OpenSearch has been working to transform its product into a complete SIEM with a detection engine, however... it's VERY buggy. I tested it several times with real data and always ended up with a corrupted index.
I looked into Elastalert, but I didn't like its engine; I found the code and maintenance too confusing. Also, why create a rules system when I can use the datasource's own language? So instead of forking, I created my own solution.
I created ClickDetect to help security teams around the world have an additional tool for generating alerts.
Clickdetect
Clickdetect is an alerting system tool created to help you to create your detection strategy in whatever datasource you want.
Clickdetect has many datasources supported like: - Clickhouse (+sigma) - Opensearch + Opensearch PPL (+sigma) - Elasticsearch - Victorialogs - PostgreSQL - Loki (+sigma) - Databricks
Clickdetect is multi-tenant by default, you can specify tenant in rules too.
Sigma
Clickdetect v1.4.0 actually supports sigma backend. Check out the documentation https://clickdetect.souzo.me/sigma/
Opensearch & Opensearch PPL
I created ClickDetect to work primarily with ClickHouse because, in my opinion, it's a better alternative, as it allows for magnificent data compression, which directly impacts the price of SOC services. Furthermore, wazuh's data is structured, so the ClickHouse JSON column makes more sense (My opinion).
But in this post I will show that it's possible to use ClickDetect with OpenSearch.
PPL (Piped Processing Language)
Opensearchppl is used to search, filter, and analyze data in an easy and intuitive way. It's very similar to the LogQL language of Loki or Splunk SPL.
This greatly increases the possibility of turning OpenSearch into a SIEM instead of running queries in the standard DSL format.
Why not SQL?
If you want SQL, try clickhouse or postgresql of tigerdata. PPL makes more sense for Opensearch environment.
Architecture
Here's how all the pieces fit together:
Wazuh ships events into the OpenSearch indexer. Clickdetect queries the indexer using PPL (or compiled Sigma rules), evaluates the configured rules on a schedule, and fires alerts to your webhooks when a condition is met.
Let's bora
Installing Opensearch PPL in Wazuh
Following the documentation, we first need to install SQL plugin https://docs.opensearch.org/latest/sql-and-ppl/ppl/index/.
Your openseach configurations and binaries are in the directory /usr/share/wazuh-indexer/. Change your directory
First, verify if your opensearch does not have Opensearch SQL Plugin installed. The plugin usually comes pre-installed with Wazuh.
If the plugin is not installed, install it.
Restart your wazuh indexer
Now It's fully operational.
Installing and configuring clickdetect
Creating rules
mkdir -p rules/
cat << EOF > rules/manager_started.yml
id: $(cat /proc/sys/kernel/random/uuid)
name: "Wazuh opensearch sigma test - Manager Started"
level: 10
size: ">0"
active: true
author:
    - Vinicius Morais <[email protected]>
group: base_rule
tags:
    - base
rule: |-
    search source=wazuh-alerts-* | where rule.id='502' and `@timestamp` >= DATE_SUB(NOW(), INTERVAL 5 HOUR )
EOF
Creating runner
You need to configure a runner, runner is a file that configure the schedulers, webhooks and the datasource.
For this example, we will use "teams" as the webhook and configure the detector to run every 5 minute.
cat << EOF > runner.yml
datasource:
    type: opensearch-ppl
    url: https://127.0.0.1:9200
    username: wazuh
    password: wazuh-adm
    verify: false

webhooks:
    teams_alert:
        type: teams
        url: https://<your_companie>.webhook.office.com/...
        timeout: 10
        verify: false

detectors:
    my_detector:
        name: "5m interval"
        for: "5m"
        description: "detect rules with 5 min interval"
        rules:
            - "/app/rules/*"
        webhooks:
            - teams_alert
Running
Now you can run with docker.
docker run -v ./runner.yml:/app/runner.yml -v ./rules/:/app/rules/ ghcr.io/clicksiem/clickdetect:latest
Results
Running
Clickdetect starts up, loads the rule from rules/, and schedules the detector to run every 5 minutes.
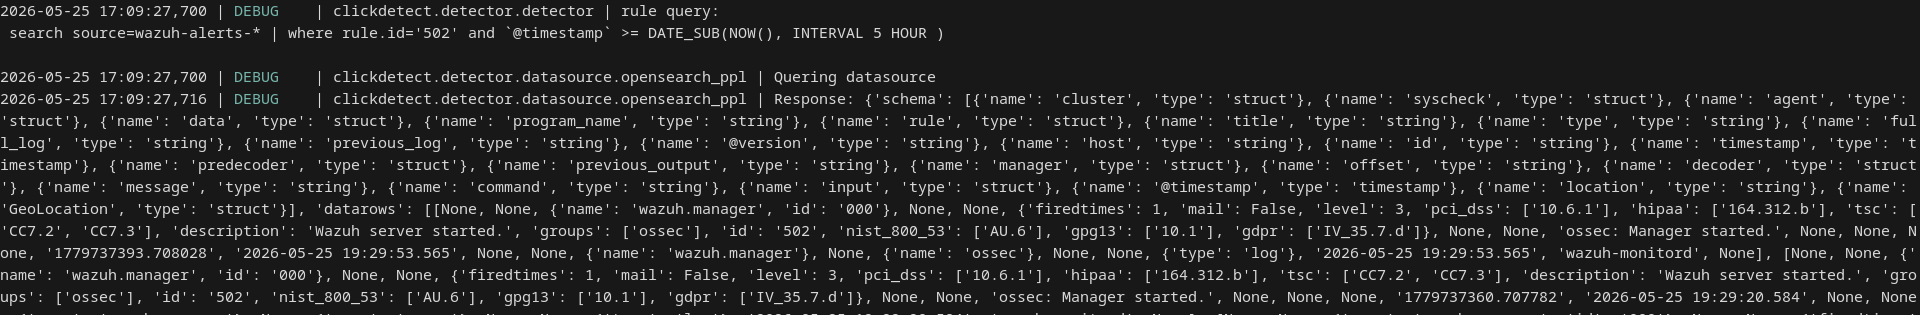
Results in terminal
The terminal output shows the rule matched at least one event. Each match includes the rule name, level, and the raw document returned by the PPL query.
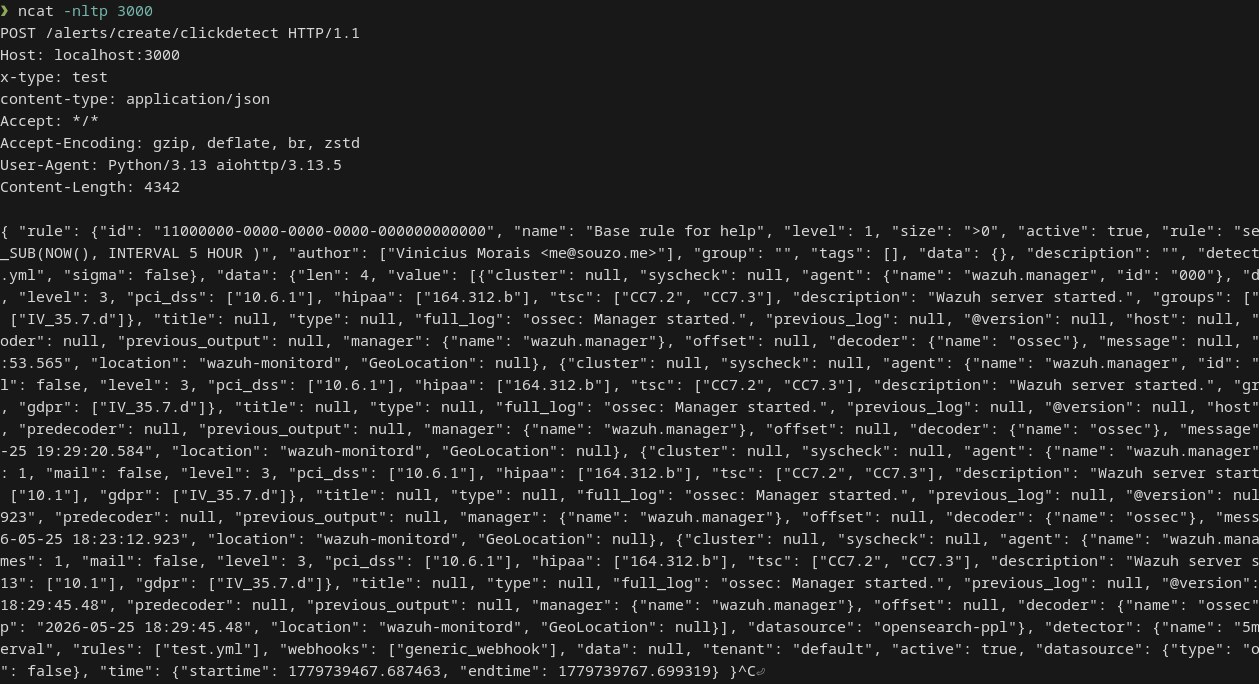
Results in teams
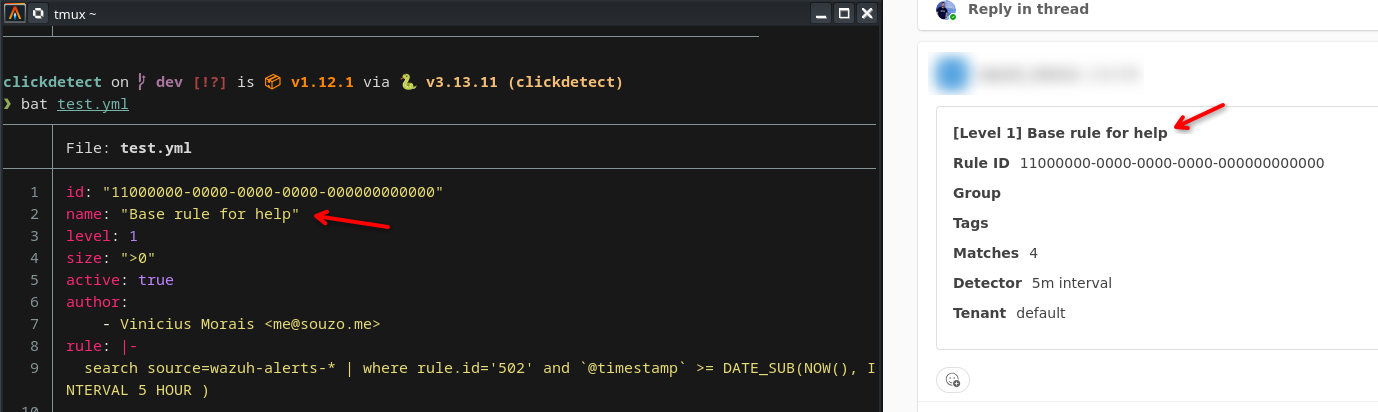
The Teams webhook delivers the alert card with the rule name, severity level, and a summary of the matched events.
Going further
This is an extra to you understand the potential.
Sigma rules
You can use sigma rules with clickdetect, check out the documentation. https://clickdetect.souzo.me/sigma/
Configure rule
WARNING: opensearch PPL sigma backend I'ts aligned with the latest opensearch version, "earliest" and "latest" I'ts not recorinized in wazuh indexer 2.19
Let's create the sigma rule directory and save the sigma rule.
Save your rule inside the created directory.
cat << EOF > rules/sigma/manager_started.yml
title: "wazuh opensearch sigma test - Manager Started"
status: test
id: 32bc608c-67ab-4d58-8361-35d3baac726c
logsource:
    product: wazuh
    category: indexer
detection:
    sel:
        rule.id: '502'
    condition: 1 of sel
custom:
    opensearch_ppl_min_time: "-5m"
    opensearch_ppl_max_time: "now"
EOF
Configure runner
Change the directory of rule in you runner
cat << EOF > runner.yml
datasource:
    type: opensearch-ppl
    url: https://127.0.0.1:9200
    username: wazuh
    password: wazuh-adm
    verify: false

webhooks:
    teams_alert:
        type: teams
        url: https://<your_companie>.webhook.office.com/...
        timeout: 10
        verify: false

detectors:
    my_sigma_detector:
        name: "5m interval"
        for: "5m"
        description: "detect sigma rule with 5 min interval"
        rules:
            - "/app/rules/sigma/*"
        sigma: true
        webhooks:
            - teams_alert
Run
Now you can run.
docker run -v ./runner.yml:/app/runner.yml -v ./rules/:/app/rules/ ghcr.io/clicksiem/clickdetect:latest
AI
Clickdetect + AI SOC Agent. You can specify an AI to auto analyze and generate score using clickdetect agentic plugin.
Example with deepseek.
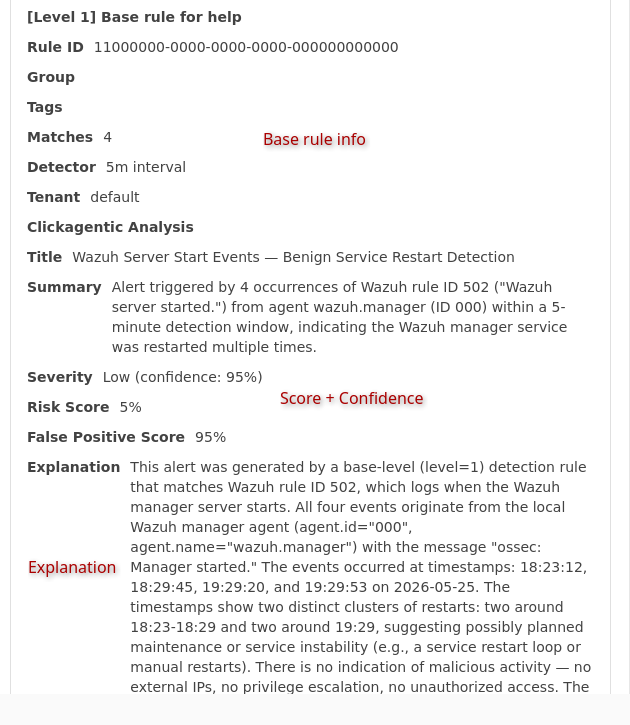
Results
This is the result of clickagentic with teams webhook.
Check out the documentation: https://clickdetect.souzo.me/plugin/clickagentic/
Conclusion
With this blog post now you can: - Run Sigma rules inside your wazuh environment - Perform multi tenant search and cross site search - Perform correlation between different logs sources - Improve your SOC team.
Clickdetect is not affiliated to ClickHouse, and I'm not sponsored (yet).
If this post helped you, consider giving clickdetect a star on GitHub — it helps the project reach more security teams. :star:
Follow my social: * E-mail: [email protected] * Matrix: @souzo:matrix.org - Twitter/X: https://x.com/souzomain - Linkedin: https://www.linkedin.com/in/vinicius-m-a76ba51b5/ - Reddit: https://www.reddit.com/user/_souzo/