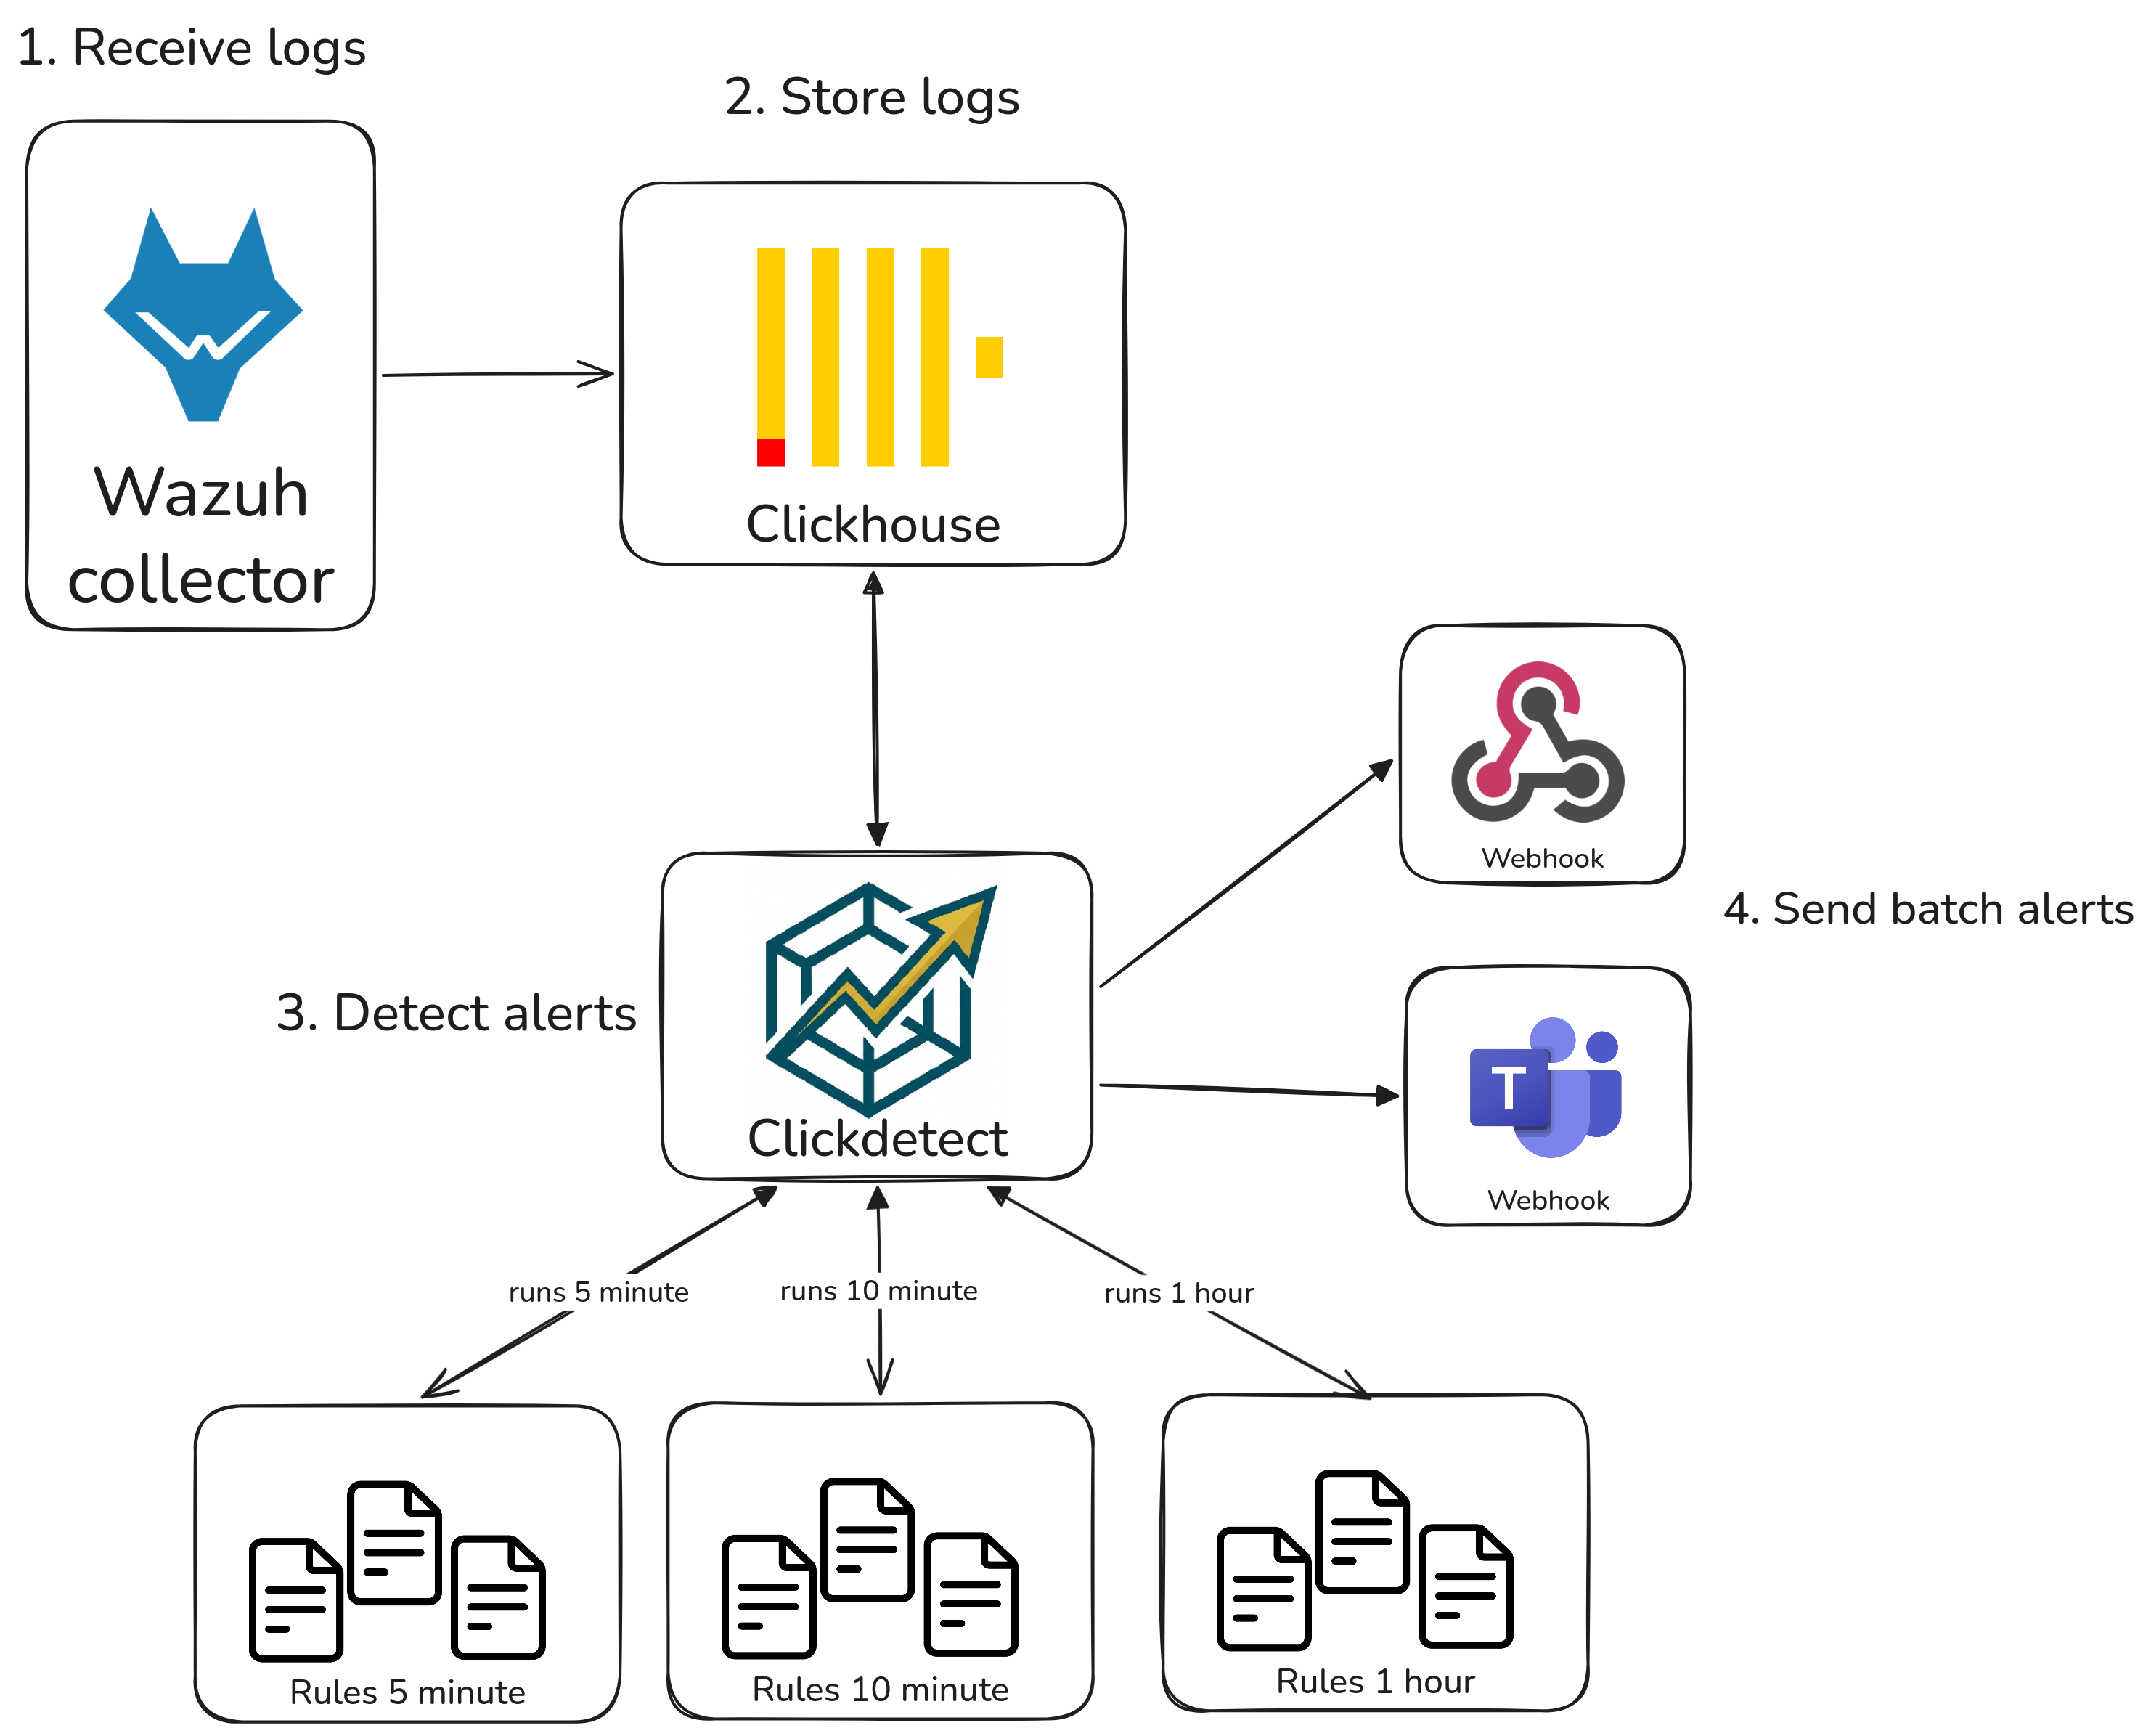
Leveraging Wazuh detection and alerting with Clickdetect
Hey, souzo here. In this blog post I'll show you how to extend Wazuh's detection and alerting capabilities using Clickdetect.
Wazuh is a fantastic open-source security platform — it collects logs from agents, parses events, and fires alerts based on its built-in rule engine. However, once you start running it at scale or need more sophisticated detection logic, you quickly hit a wall. The rule engine is static, alert correlation is limited to a single source at a time, and there is no native support for anomaly detection or complex aggregations.
That's where Clickdetect comes in. By storing Wazuh alerts in ClickHouse, we unlock the full power of SQL to build detections that simply aren't possible inside Wazuh alone. If you're not familiar with how to set up ClickHouse and Clickdetect together, check out my previous post: Building a powerful SIEM with ClickHouse and Clickdetect.
Detections like:
- Multiple source correlation — correlate events across different log sources (e.g., firewall + EDR) in a single query
- Anomaly detection — detect unusual patterns using statistical functions and time-window aggregations
- Threshold-based detection — count events per user, IP, or host over sliding time windows
- Batch alerting — group related alerts before sending notifications, reducing alert fatigue
Why?
Wazuh's (OSSEC-based) alert engine has several fundamental limitations by design. Wazuh 5 may address some of them, but it looks like it will remain tied to OpenSearch.
What Wazuh's alert engine can't do:
- Anomaly detection
- Multiple source correlation
- Complex queries and log searches
- Threshold-based detection
- Multi-tenant queries
- Sending alerts to third-party platforms
There is also the alert fatigue problem: Wazuh sends each alert individually. Clickdetect can batch related alerts into a single notification, dramatically reducing noise.
SQL detections
All queries below run against ClickHouse tables populated with Wazuh alerts. Each detection is scheduled as a Clickdetect rule and fires an alert whenever results are returned.
Multiple source correlation
Users authenticating from too many distinct IPs (Fortigate VPN)
This query detects users who authenticated through the Fortigate VPN from more than 5 distinct source IPs in the last 20 minutes. A single user connecting from many different IPs in a short window is a strong indicator of credential stuffing or a compromised account being used across multiple locations.
SELECT
    alert.data.srcuser::String as srcuser,
    count(DISTINCT alert.data.srcip) as unique_ip
FROM wazuh_alerts
PREWHERE timestamp >= now() - INTERVAL 20 MINUTE
WHERE has(rule_groups, 'fortigate')
GROUP BY srcuser
HAVING unique_ip > 5
LIMIT 100
CrowdStrike endpoint alerts
This query surfaces the most recent CrowdStrike endpoint detections ingested via Wazuh, returning the alert description and the local IP of the affected host. Useful for correlating EDR detections with other log sources like firewall or authentication logs.
SELECT
    rule_description,
    alert.data.event.LocalIP::String as LocalIP,
    alert.data.event.Description::String as Description
FROM
    wazuh_alerts_dist
PREWHERE timestamp >= now() - INTERVAL 10 MINUTE
WHERE has(rule_groups, 'crowdstrike')
LIMIT 10
SSH brute force followed by successful login
This query correlates two types of events on the same host: a burst of SSH authentication failures followed by a successful login — a classic brute force pattern. Both events must happen within the same 10-minute window on the same agent to trigger the alert.
SELECT
    agent_name,
    countIf(rule_id = '5710') as failed_logins,
    countIf(rule_id = '5715') as successful_logins
FROM wazuh_alerts
PREWHERE timestamp >= now() - INTERVAL 10 MINUTE
WHERE has(rule_groups, 'syslog') AND has(rule_groups, 'authentication')
GROUP BY agent_name
HAVING failed_logins >= 10 AND successful_logins >= 1
LIMIT 100
New admin user created after a privilege escalation alert
This query looks for hosts where a privilege escalation alert (e.g., a sudo rule) and a user account creation event both occurred in the last 15 minutes. The combination of these two signals on the same host is a strong indicator of post-exploitation activity.
SELECT
    agent_name,
    countIf(has(rule_groups, 'sudo')) as sudo_events,
    countIf(has(rule_groups, 'account_changes')) as account_changes
FROM wazuh_alerts
PREWHERE timestamp >= now() - INTERVAL 15 MINUTE
GROUP BY agent_name
HAVING sudo_events >= 1 AND account_changes >= 1
LIMIT 50
Lateral movement: same source IP hitting multiple hosts
This query identifies source IPs that have triggered authentication alerts on more than 3 distinct agents in the last 10 minutes. A single IP probing many hosts in a short window is a strong indicator of lateral movement or internal scanning.
SELECT
    alert.data.srcip::String as srcip,
    count(DISTINCT agent_name) as targeted_hosts,
    groupArray(DISTINCT agent_name) as hosts
FROM wazuh_alerts
PREWHERE timestamp >= now() - INTERVAL 10 MINUTE
WHERE has(rule_groups, 'authentication_failed')
  AND alert.data.srcip::String != ''
GROUP BY srcip
HAVING targeted_hosts > 3
ORDER BY targeted_hosts DESC
LIMIT 50
Anomaly detection
Spike in rule triggers
This query counts how many times each rule fired in the last 5 minutes and compares it against the same rule's volume in the previous hour. Rules where the recent count is more than 3x the historical average are flagged — catching alert storms from malware spreading, scanning activity, or a misconfigured agent before they flood your notification channels.
SELECT
    rule_id,
    rule_description,
    countIf(timestamp >= now() - INTERVAL 5 MINUTE) AS recent_count,
    countIf(timestamp < now() - INTERVAL 5 MINUTE) / 11 AS baseline_avg,
    round(recent_count / nullIf(baseline_avg, 0), 2) AS spike_ratio
FROM wazuh_alerts
PREWHERE timestamp >= now() - INTERVAL 1 HOUR
GROUP BY rule_id, rule_description
HAVING recent_count >= 5 AND spike_ratio > 3
ORDER BY spike_ratio DESC
LIMIT 50
Agents that stopped sending alerts
Silence can be just as suspicious as noise. This query returns agents that were active in the last hour but have sent no alerts in the last 10 minutes — which may indicate a downed agent, a network issue, or an attacker disabling the Wazuh service.
SELECT DISTINCT agent_name
FROM wazuh_alerts
WHERE timestamp >= now() - INTERVAL 1 HOUR
  AND agent_name NOT IN (
      SELECT DISTINCT agent_name
      FROM wazuh_alerts
      WHERE timestamp >= now() - INTERVAL 10 MINUTE
  )
ORDER BY agent_name
LIMIT 100
SQL Considerations
When querying large time intervals — 1 hour, 1 day, or more — scanning raw alert tables on every run can become expensive. A refreshable materialized view that pre-aggregates the data is usually a better choice.
Here is an example for the Spike detection use case:
CREATE TABLE IF NOT EXISTS hour_update_table_spike_data
(
    window_start DateTime,
    rule_id      String,
    rule_description String,
    alert_count  UInt64
)
ENGINE = MergeTree()
ORDER BY (window_start, rule_id);

CREATE MATERIALIZED VIEW IF NOT EXISTS hour_update_table_spike_data_mv
REFRESH EVERY 1 HOUR TO hour_update_table_spike_data AS
SELECT
    toStartOfHour(now())  AS window_start,
    rule_id,
    rule_description,
    count()               AS alert_count
FROM wazuh_alerts
WHERE timestamp >= now() - INTERVAL 1 HOUR
GROUP BY rule_id, rule_description;
With the materialized view in place, the spike detection rule can be rewritten to query the pre-aggregated table instead of scanning raw alerts:
SELECT
    rule_id,
    rule_description,
    recent.alert_count AS recent_count,
    round(avg(h.alert_count), 2) AS baseline_avg,
    round(recent.alert_count / nullIf(avg(h.alert_count), 0), 2) AS spike_ratio
FROM (
    SELECT rule_id, rule_description, alert_count
    FROM hour_update_table_spike_data
    WHERE window_start = toStartOfHour(now())
) AS recent
JOIN hour_update_table_spike_data AS h USING (rule_id)
WHERE h.window_start >= toStartOfHour(now()) - INTERVAL 24 HOUR
  AND h.window_start < toStartOfHour(now())
GROUP BY rule_id, rule_description, recent.alert_count
HAVING recent_count >= 5 AND spike_ratio > 3
ORDER BY spike_ratio DESC
LIMIT 50
Using these detections with Clickdetect
Each SQL query above becomes a Clickdetect rule — a YAML file that wraps the query with metadata, a firing condition, and severity information. Clickdetect evaluates the rule on a schedule and fires an alert to your configured webhook whenever the query returns results.
Rule file structure
Take the brute force + successful login detection as an example:
id: "wazuh-001"
name: SSH Brute Force Followed by Successful Login
level: 9
size: ">0"
active: true
author:
    - souzo
group: wazuh
tags:
    - brute_force
    - authentication
    - ssh
description: "Detects hosts with 10+ SSH failures followed by a successful login in the last 10 minutes"
rule: |-
    SELECT
        agent_name,
        countIf(rule_id = '5710') as failed_logins,
        countIf(rule_id = '5715') as successful_logins
    FROM wazuh_alerts
    PREWHERE timestamp >= now() - INTERVAL 10 MINUTE
    WHERE has(rule_groups, 'syslog') AND has(rule_groups, 'authentication')
    GROUP BY agent_name
    HAVING failed_logins >= 10 AND successful_logins >= 1
    LIMIT 100
The size: ">0" condition means the alert fires as soon as the query returns at least one row. For detections where you want a higher threshold before alerting (e.g., only fire if 5 or more agents are affected), you can use size: ">=5".
Organizing rules by detector
A good practice is to group rules by their evaluation interval. Rules that query short time windows (5–10 minutes) should run frequently; rules with longer windows (1 hour) can run less often.
# runner.yml
datasource:
    type: clickhouse
    host: clickhouse
    port: 8123
    username: default
    password: ""
    database: default

webhooks:
    security_alerts:
        type: generic
        url: http://your-alerting-platform/webhook
    teams_integration:
        type: teams
        url: https://xyz.webhook.office.com/...

detectors:
    wazuh_5m:
        name: "Wazuh — 5 minute checks"
        for: "5m"
        tenant: "default"
        rules:
            - "rules/wazuh/5m/*.yml"
        webhooks:
            - security_alerts
            - teams_integration

    wazuh_10m:
        name: "Wazuh — 10 minute checks"
        for: "10m"
        tenant: "default"
        rules:
            - "rules/wazuh/10m/*.yml"
        webhooks:
            - security_alerts

    wazuh_1h:
        name: "Wazuh — hourly checks"
        for: "1h"
        tenant: "default"
        rules:
            - "rules/wazuh/1h/*.yml"
        webhooks:
            - security_alerts
A suggested layout for the rules directory:
rules/
└── wazuh/
    ├── 5m/
    │   └── spike_detection.yml
    ├── 10m/
    │   ├── ssh_brute_force.yml
    │   ├── lateral_movement.yml
    │   └── privilege_escalation.yml
    └── 1h/
        └── silent_agents.yml
Using startime and endtime for precise windows
Instead of using now() directly in your queries, you can use the {{ startime }} and {{ endtime }} template variables that Clickdetect injects at runtime. These are Unix timestamps corresponding to the detector's evaluation window, which avoids clock drift between query execution and the intended time range.
rule: |-
    SELECT
        alert.data.srcip::String as srcip,
        count(DISTINCT agent_name) as targeted_hosts,
        groupArray(DISTINCT agent_name) as hosts
    FROM wazuh_alerts
    WHERE timestamp >= fromUnixTimestamp({{ startime }})
      AND timestamp <= fromUnixTimestamp({{ endtime }})
      AND has(rule_groups, 'authentication_failed')
      AND alert.data.srcip::String != ''
    GROUP BY srcip
    HAVING targeted_hosts > 3
    ORDER BY targeted_hosts DESC
    LIMIT 50
Tuning thresholds per environment
If your thresholds need to vary between environments or tenants, use the data field on the rule to make them configurable without duplicating the YAML:
id: "wazuh-002"
name: VPN User Authenticating from Too Many IPs
description: "User authenticated from more than {{ rule.data.max_ips }} distinct IPs via Fortigate VPN"
level: 7
size: ">0"
group: wazuh
tags:
    - vpn
    - credential_stuffing
data:
    max_ips: 5
rule: |-
    SELECT
        alert.data.srcuser::String as srcuser,
        count(DISTINCT alert.data.srcip) as unique_ip
    FROM wazuh_alerts
    PREWHERE timestamp >= fromUnixTimestamp({{ startime }})
    WHERE has(rule_groups, 'fortigate')
    GROUP BY srcuser
    HAVING unique_ip > {{ rule.data.max_ips }}
    LIMIT 100
Note: You can use Jinja template in description like the example above. I added this feature while writing this post :)
Conclusion
Wazuh is a solid foundation for endpoint and log visibility, but its detection engine was never designed for the kind of analytical workloads that modern threat detection demands. By routing Wazuh alerts into ClickHouse and wrapping SQL queries with Clickdetect rules, you get a detection layer that scales, correlates across sources, and sends batched notifications to any platform you already use.
The patterns shown here — brute force correlation, lateral movement detection, silent agent monitoring, and spike detection — are just a starting point. Any behavior you can express as a SQL query over time-windowed data can become a Clickdetect rule.
If you have questions or want to share a detection you built, feel free to open an issue or discussion on the Clickdetect repository.